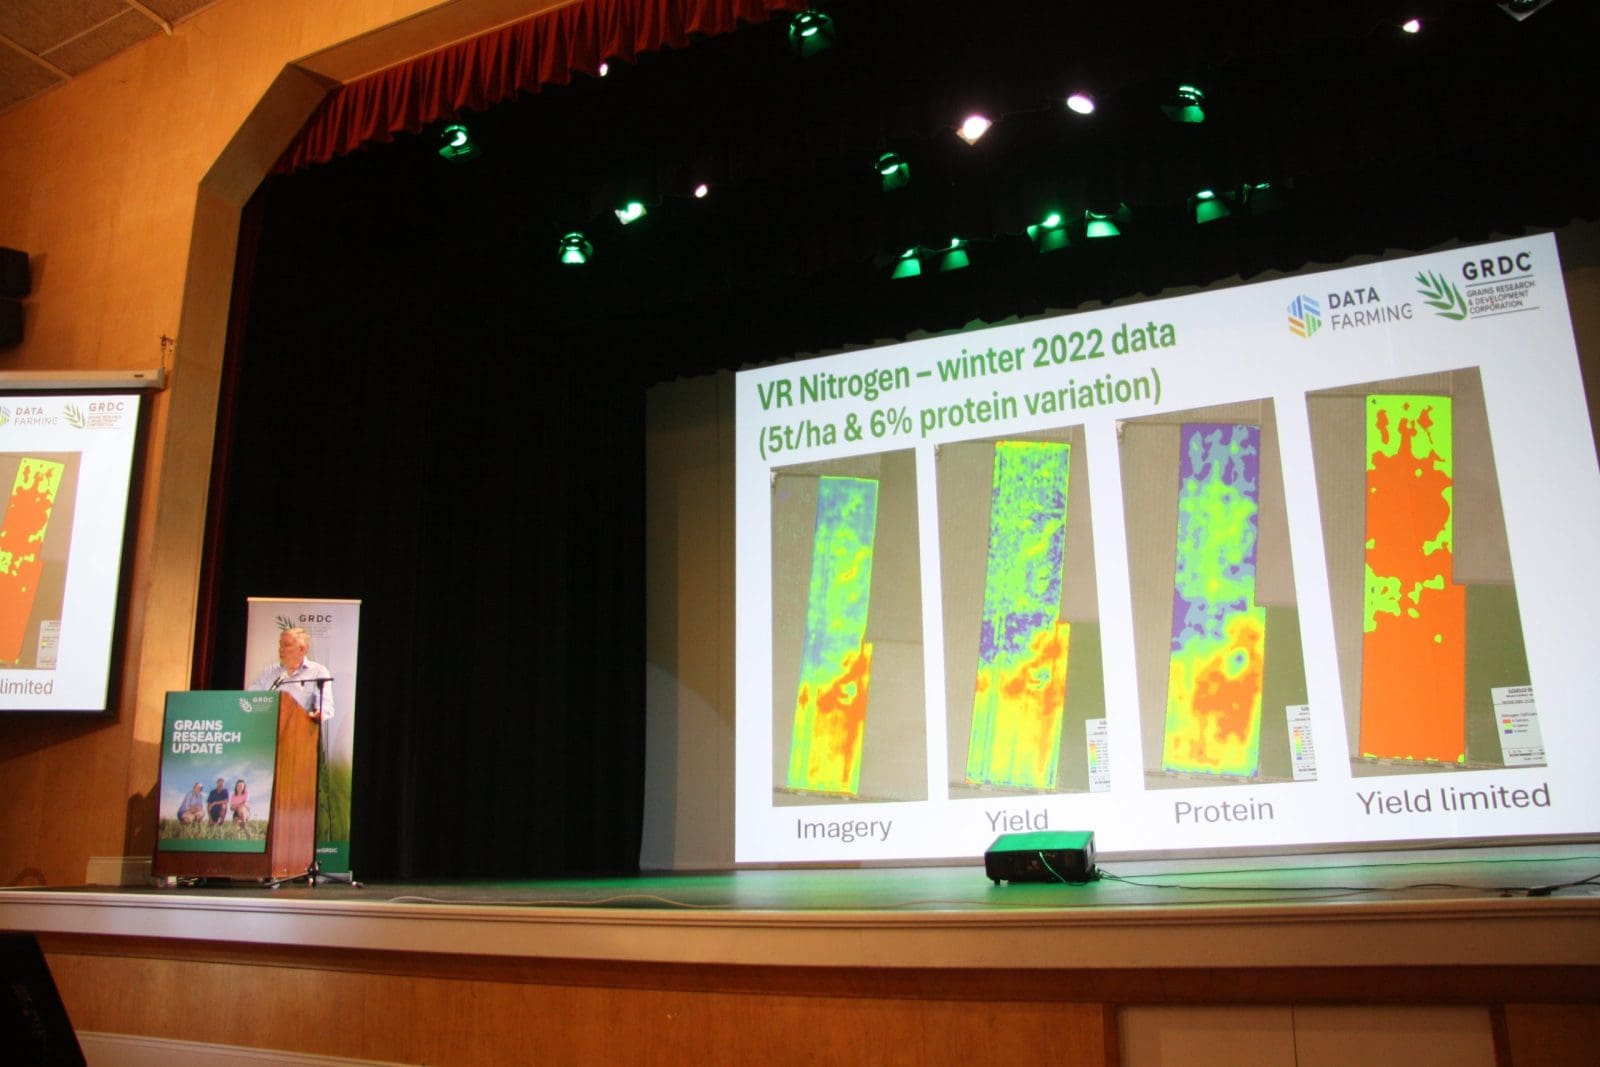
DataFarming’s Tim Neale shows the 2025 GRDC Goondiwindi Update images of a 2022 wheat crop at Warra, Qld, with a yield variability of 5t/ha and 6pc in protein.
AS CO-FOUNDER and managing director of DataFarming, Tim Neale has what you might call a bird’s-eye view of cropping in Australia.
It comes from satellite imagery, and conversations with growers, agronomists, and researchers, and in his address to the Grains Research and Development Corporation Goondiwindi Update on Tuesday, it pointed fairly and squarely to the drag of low yields in paddocks with higher-yielding potential.
“We’re still seeing 200-300 percent variability in our yields, and that’s across the board,” Mr Neale told the gathering of around 300 delegates.
He pinpointed yield and protein data, EM and satellite mapping, targeted soil testing as tools to use to guide variable-rate technology that can help even out performance in paddocks, and said handheld technology also had a role to play.
“Yield data still remains our best measure of performance, but I think as an industry we’ve completely failed in delivering simple-to-use tools to growers and agronomists that can have access to yield data on your phone without complicated software; we still haven’t got there.
“I think we’ve done an abysmal job on this; after 30 years of yield mapping, I still don’t see that in the marketplace.”
Cost-price squeeze coming
Mr Neale gave the GRDC Update audience a rundown that pointed to opposite ends of the spectrum in terms of yield and protein evenness.
They ranged from Grenfell, NSW, grower Broden Holland, who has used variable rates to get wheat paddocks to within a 1t/ha and 1pc protein variation to a paddock at Warra on Queensland’s Western Downs, where a 5t/ha yield and 6pc protein variation was evident, partly because of waterlogging.
“When are we going to go: ‘This is a really big problem, and really get hold of this and make a change’?
“It is costing the industry a heap; I can tell you, every yield map, a quarter or a half the paddock is losing money; it’s being subsidised by the top half of the paddock.
“We can’t keep going like that; otherwise the cost-price squeeze will beat us again.”
“We can’t continue to do…blanket everything across these fields anymore.”
“We’ve got to look into detail about how we manage this variability going forward because what’s happening… is that our attention to detail has sort of dropped off the cliff.”
Mr Neale said a single paddock now can encompass what in decades past could have been six or eight farms.
“The only way we can get back with the amount of staff and people that we’ve got now is to focus on technology.”
Start with mapping, testing
Under the topic of Precision fertiliser decisions in a tight economic climate, Mr Neale pointed to electromagnetic (EM) mapping, which has been around since the 1950s, and targeted soil testing as the first steps for growers who wanted to rectify underperformance in the paddocks.
As DataFarming’s bread and butter, Mr Neale also sees satellite imagery as useful.
“The number of satellites has basically doubled in the last two years…so we’ve got a lot more data to play with, and it’s in pretty much real time.
“It can really help us pull together what’s happening instantly now, or what’s happened over the last 10 years.”
Resolution is also getting higher, and while free-to-use 10m x 10m pixels provide a good indication of what is occurring in a paddock, military-grade 30cm-pixels are even better and, as of this week, 10cm pixels have become accessible.

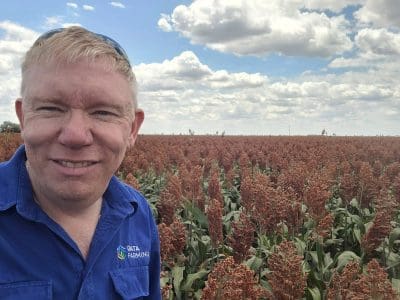
Tim Neale inspects a sorghum crop on the Downs early last month. Photo: DataFarming
Mr Neale said insights from satellite imagery and yield and protein data have funnelled growers into more targeted soil testing.
“I’ve seen a big change in the last few years, where we’re really starting to drill down at a zonal basis rather than taking six cores across the paddock, putting them in a bucket, and hoping like hell all the results make…something meaningful.”
Mr Neale said using those maps to inform variable-rate technology was on the rise, as evidenced by a recent GRDC workshop at Corowa involving DataFarming where 80pc of attendees indicated they were using VR.
“GRDC has made some investments in this area but I think there’s plenty of opportunity here to do better at measuring responses on our own farms.
“I’ve always had this adage that every farm should be a research station.
“Why aren’t we testing our own responses and our own environments a lot more? What we need to do is use the technology to do that so we’re not wasting our time.”
Mixed soils a challenge
Mr Neale cited the example of a paddock with soils that had low subsoil constraints, and zero nitrogen in the profile according to soil tests, as well as acidic deep Brigalow clay with subsoil constraints, and pH neutral topsoil above highly alkaline then highly acid soil.
“Accumulated in that profile was over 1000kg of nitrogen.
“If I’m doing my normal testing, I’ll take six cores across that field and bulk them all into one, and I’m going to get a result of probably 300-400kg, and that couldn’t be further from the truth.
“Unless we understand that variability, we’re going to get these very average results and areas of this field are suffering in yield because we haven’t applied enough nitrogen, and over the last 20 years they’ve put on way too much nitrogen in some other parts.”
Such content can also point to the application of ameliorants like variable-rate gypsum in clays, and he spoke of other paddocks north of Goondiwindi with “enormous variability” in some types from “basically just beach sand” to “melon-hole country”.
“This is typical of our environment here.
“We’ve got to get more precise about understanding this variability and sampling as a result.
EM mapping gets down to 1.5m in the soil profile, and Mr Neale said soil pits as well as cores can be of value to better understand the subsoil, while strip testing of different seeding and fertiliser rates could also be highly valuable.
Watch on weeds
Satellite imagery can also be used to detect weeds, with specific algorithms used to buffer images to create a map for a spray unit to use.
“We then load that file into the sprayer and this is just section control, so no fancy hardware, no fancy software on this machine.
“It’s picking up those bigger, hard-to-kill weeds and just turning that section on and off, and so we’ve got massive savings in product there.”
Mr Neale gave the example of a grower who used a map to find out he needed to spray only 23ha out of a 130ha paddock.
“He knew exactly how much chemical he needed to put in the tank, and he saved about $9000 worth of chemical that morning, all from that simple file.
Grain Central: Get our free news straight to your inbox – Click here